
The Five Female Figure Types
Pattern Making Academy has taken an innovative approach to pattern engineering, based on body shape as opposed to garment size.
After many years of working in education and industry, Kath Berry came to the conclusion that the size and shape of Australian women had changed dramatically over the past five decades. In 1996, Kath embarked on a scientific research project with the purpose of gathering data to develop a pattern engineering system specifically for a variety of figure types.
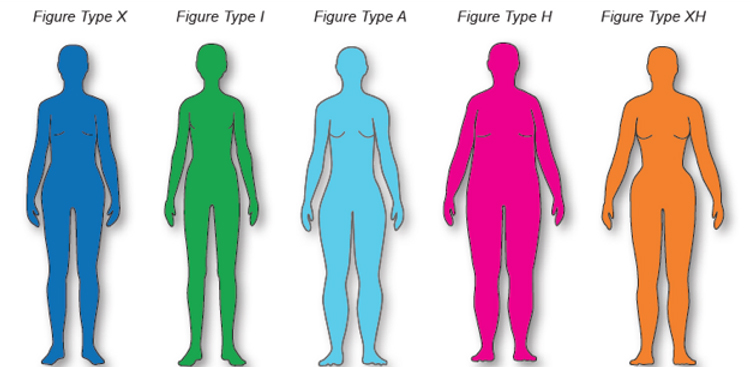
This research identified five main female figure types presented below.
Which Figure Type are you? One of these or a combination?
The following descriptions identify the key characteristics of each figure type.
Note the position and angle of the lines drawn from the shoulder tip [acromion] to the upper hip, lower hip, and thigh regions.
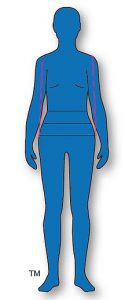 Figure Type X (Hourglass)
- Medium frame
- Medium to full bust
- Slightly muscular
- Defined waistline
- Lower hip slightly larger than bust
Lines drawn from the tip of the shoulder to the lower hipline show a slight angle, and the defined waistline.
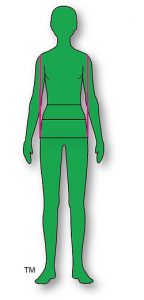 Figure Type I (Twiggy):
- Narrow frame
- Slender body
- Small to medium bust
- Small waist and hip
- Slight waist definition
- Similar bust and lower hip
- Straight silhouette
Lines drawn from the tip of the shoulder to the lower hip are parallel.
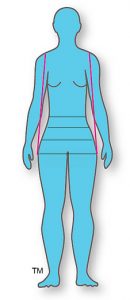 Figure Type A (Curvy):
- Small to medium frame
- Small to medium bust
- Small waist
- Hip and thigh are larger than bust
- Thigh is larger than the lower hip
- Often presents with sway back and slightly protruding abdomen
Lines drawn from the tip of the shoulder by-pass the lower hip and touch the thigh region. Note the small narrow waist and prominent thighs.
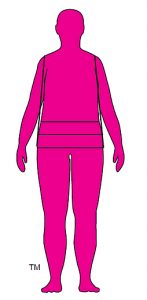 Figure Type H (Fuller Figure):
- Large frame
- Well-developed upper arm
- Small, medium or large bust
- Full waist and abdomen
- Little or no waist definition
- Narrow shoulder compared to breadth of upper body
- Medium or large hip
Lines drawn from the tip of the shoulder to the lower hipline show very little waist definition. Note the fuller rectangular silhouette.
 Figure Type XH (Combination):
- Medium frame
- Small, medium or full bust
- Well defined waistline
- Full upper hip
- Combination of Figure Types X and H.
Lines drawn from the tip of the shoulder touch the upper hipline. Note the clearly defined waistline.
The five figure types are used extensively throughout PMA’s FD ~ CS series of publications, where they are represented by letters of the alphabet. Each figure type is colour coded for easy identification.
The averaged body measurements, specific for each figure type, are used for the steps and procedures for drafting each master block in Units 2 to 11. A full range of averaged body measurements for all five figure types is included.
As you have no doubt gathered by now, PMA is about body size and shape as opposed to garment size. And here is the key reason:- the reality today, that female body size and shape has changed significantly over the last five decades, has had a major impact on the fit of female garments – particularly those intended for the “Ready-to-Wear” industry, where traditional sizing systems are still predominant.
Evidence suggests, that body shape variation is yet to be uniformly accepted by many brands, retailers, designers or manufacturers, and even customers.
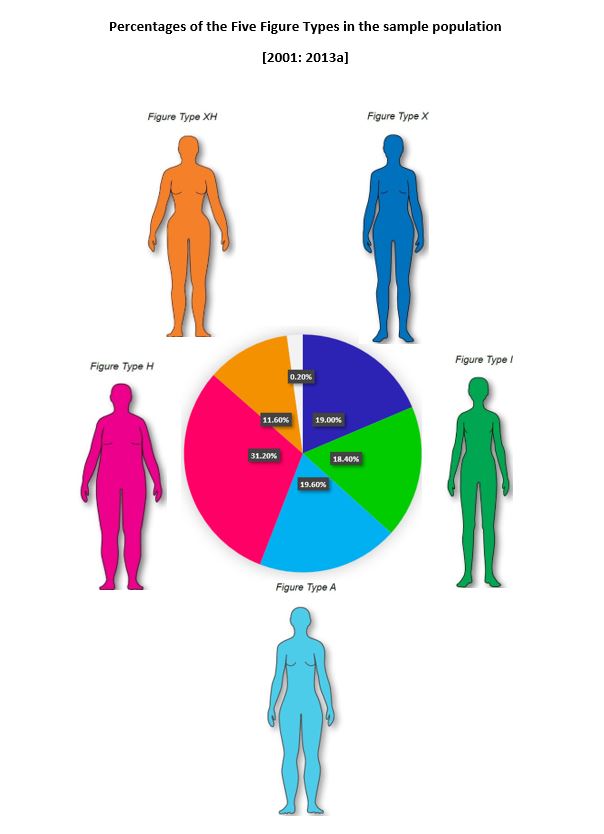
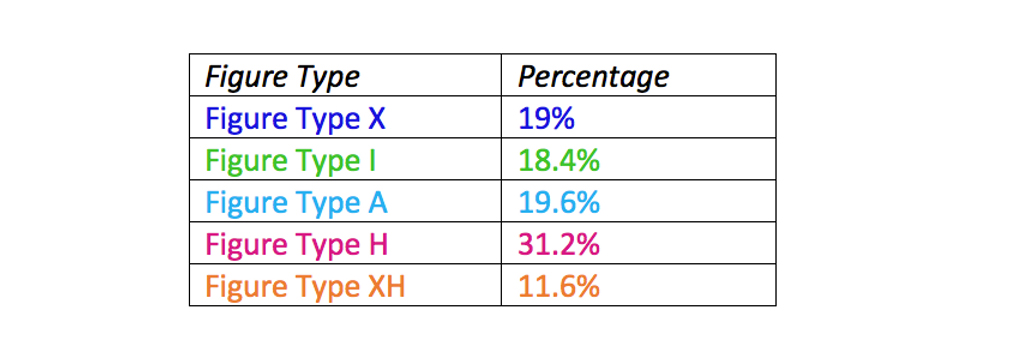
The table and pie chart below show the population percentages of each figure type. It is notable that Figure Type H represents the highest percentage. This result is supported by the World Health Organisation [WHO] in relation to the rise in weight issues throughout the world.
The table also shows that the five different figure types accounted for around 98% of the sample population.
It stands to reason that when figure type percentages such as this are reliably categorized, body shape variation must be a major consideration for the sizing and production of well-fitting garments.
Numerous research and studies conducted overseas support the finding, that female body shape has changed substantially over the past five decades. I believe this finding is a major contributing factor for poorly fitting female garments – and the consumer and retailer frustration that results.
Unit 12 explores the sizing “dilemma” in more detail, and includes opinions and suggestions made by various industry commentators.